E2A2 — hyperspectral (AVIRIS, 224 channels)#
E2A2 (E²A², Encoding Efficient Asymmetric Autoencoders, github.com/danjacobellis/E2A2) is the successor of FRAPPE v3: the same split trainer (frozen per-group encoders — one learned strided projection per latent channel — SC6 softsign companding onto the coder alphabet [−31, 31], one merged decoder per operating point) with the entropy stage replaced by GGDLPC (a learned FIR predictor per channel, two affine laws mapping a causal statistic to a folded-GGD Huffman table, plus a derived zero-run mode; the C engine builds itself on import). Every reported rate is real byte-padded stream bits, round-trip verified in this notebook by decoding the latents back from the truncated bytes.
E2A2H codes 224-band AVIRIS radiance tiles as a 224-channel image: a 5-group ladder (ps 16/8/4/2/1 × 8/24/24/12/8 channels, macroregion 64 px). Rates are bits per spatial pixel summed over all 224 bands (bits/voxel = bpp / 224).
Stream layout two_stream: one global stream (the first scale group over the whole plane, one byte-pad) plus one detail stream per macroregion (one byte-pad each). The stream for operating point n is the literal bit-prefix covering channels ≤ n.
The codec is loaded from the Hugging Face hub (danjacobellis/E2A2, hyperspectral/ subdirectory) through the compressors.e2a2 public API — there is no local checkpoint or training code in this notebook.
import json, glob
import torch, numpy as np, matplotlib.pyplot as plt
import PIL.Image
from IPython.display import display
from compressors import e2a2
from compressors.e2a2.recipes import load_aviris
Load the codec and its entropy coder#
One MergedAutoencoder per operating point, all from the hub. Each operating point has its own merged decoder (multidec); the encoders froze at merge, so every operating point’s encoder is a channel prefix of the full one. entropy.json is the GGDLPC blob (per-channel predictor taps + law scalars); the Huffman tables are generated from it when the coder loads.
NAME = 'hyperspectral'
device = 'cuda:0' if torch.cuda.is_available() else 'cpu'
config, models, coder = e2a2.load_all_codecs(NAME, device=device)
ops = list(config.cumulative_channels)
model = models[ops[-1]]
rom = e2a2.rom_facts(coder.blob)

print(f'codec         = {config.codec}/{NAME}   (hub format {config.format}, source checkpoint {config.source_checkpoint})')
print(f'modality      = {config.modality}   spatial rank = {config.dim}   input channels = {config.input_channels}')
print(f'ps ladder     = {list(config.ps)} x {list(config.group_sizes)} channels')
print(f'boundaries    = {ops}  (cumulative channels = operating points)')
for n in ops:
    d = config.decoder_configs[ops.index(n)]
    print(f'  op {n:>2}: decoder ps={d["decoder_ps"]} dim={d["decoder_dim"]} depth={d["decoder_depth"]}')
for s, (ps_s, start, end) in enumerate(model.scale_groups):
    print(f'  scale {s+1}: ps={ps_s:>4}  channels {start+1}-{end}')
print(f'\nentropy coder: GGDLPC, stream_mode={coder.stream_mode}, macroregion={coder.macroregion} px'
      + (f', global stream = channels 1-{coder.n_coarse}' if coder.n_coarse else ', no global stream'))
print(f'  alphabet [-31, 31]; persistent model = {rom["law_scalars"]} law scalars + '
      f'{rom["predictor_ints"]} predictor ints for {rom["n_channels"]} channels')
print(f'  {rom["note"]}')
codec         = E2A2/hyperspectral   (hub format e2a2_hub1, source checkpoint e2a2h4_g5.pth)
modality      = image   spatial rank = 2   input channels = 224
ps ladder     = [16, 8, 4, 2, 1] x [8, 24, 24, 12, 8] channels
boundaries    = [8, 32, 56, 68, 76]  (cumulative channels = operating points)
  op  8: decoder ps=4 dim=768 depth=12
  op 32: decoder ps=4 dim=768 depth=12
  op 56: decoder ps=4 dim=768 depth=24
  op 68: decoder ps=4 dim=768 depth=24
  op 76: decoder ps=4 dim=768 depth=24
  scale 1: ps=  16  channels 1-8
  scale 2: ps=   8  channels 9-32
  scale 3: ps=   4  channels 33-56
  scale 4: ps=   2  channels 57-68
  scale 5: ps=   1  channels 69-76

entropy coder: GGDLPC, stream_mode=two_stream, macroregion=64 px, global stream = channels 1-8
  alphabet [-31, 31]; persistent model = 456 law scalars + 456 predictor ints for 76 channels
  edges, folded GGD pmfs, quotient split, canonical Huffman tables and the run mode are GENERATED from the per-channel scalars at load (GGDLPC.tables)
Analysis filterbank#
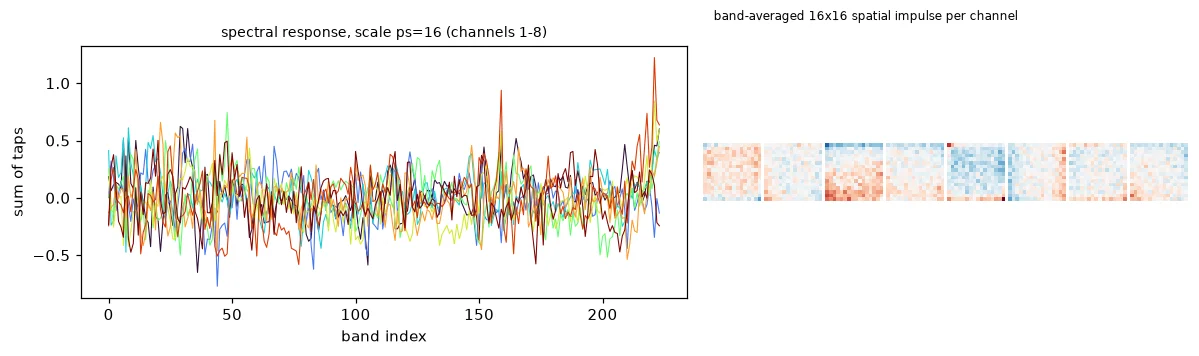
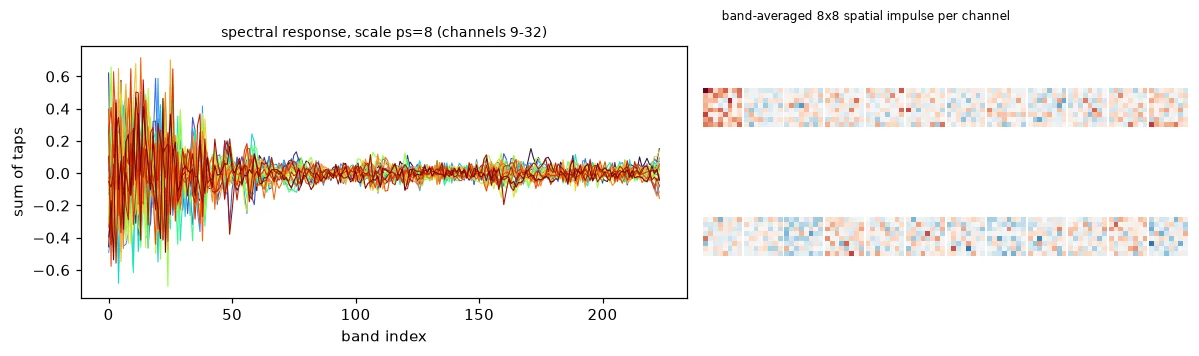
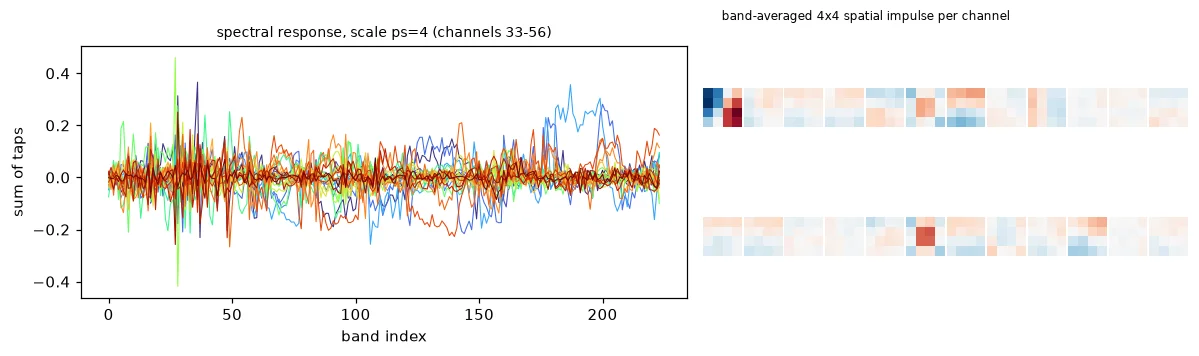
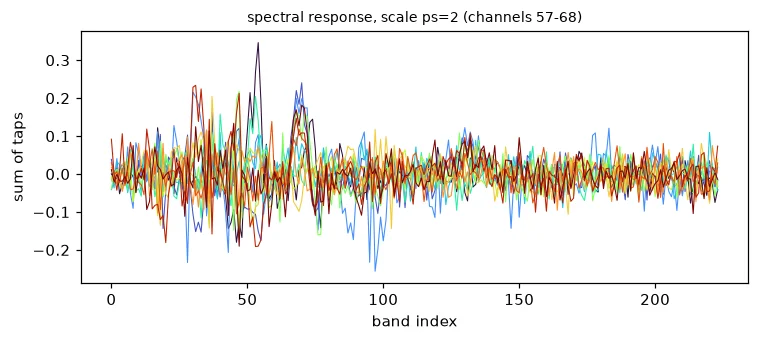
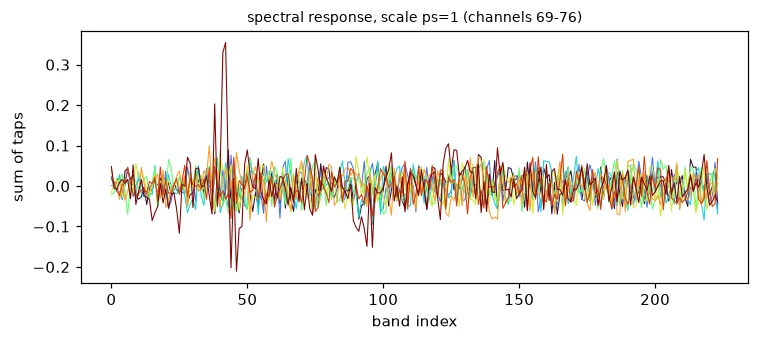
Each latent channel is a learned 224 × ps × ps projection. Left: the spectral response of each channel (taps summed over the ps×ps spatial support → one 224-vector per channel, plotted vs band index). Right (ps ≥ 4): the band-averaged spatial impulse response.
for s, (ps_s, start, end) in enumerate(model.scale_groups):
    W = model.encoders[s][0].weight.data.cpu()            # (C_g, 224, ps, ps)
    n_g = end - start
    spec = W.sum(dim=(2, 3)).numpy()                       # (C_g, 224)
    show_spatial = ps_s >= 4
    fig = plt.figure(figsize=(11 if show_spatial else 7, 3.2), dpi=110)
    gs = fig.add_gridspec(1, 2 if show_spatial else 1, width_ratios=[2, 1.6] if show_spatial else [1])
    ax = fig.add_subplot(gs[0])
    cols = plt.cm.turbo(np.linspace(0, 1, n_g))
    for j in range(n_g):
        ax.plot(spec[j], lw=0.7, color=cols[j])
    ax.set_xlabel('band index'); ax.set_ylabel('sum of taps')
    ax.set_title(f'spectral response, scale ps={ps_s} (channels {start+1}-{end})', fontsize=9)
    if show_spatial:
        cols_n = min(n_g, 12); rows_n = -(-n_g // cols_n)
        sub = gs[1].subgridspec(rows_n, cols_n, wspace=0.05, hspace=0.05)
        sp = W.mean(1).numpy()                             # (C_g, ps, ps)
        v = np.abs(sp).max()
        for j in range(n_g):
            a = fig.add_subplot(sub[j // cols_n, j % cols_n])
            a.imshow(sp[j], cmap='RdBu_r', vmin=-v, vmax=v); a.axis('off')
        fig.text(0.72, 0.97, f'band-averaged {ps_s}x{ps_s} spatial impulse per channel', fontsize=8, ha='center')
    plt.tight_layout(); plt.show()
Load an example tile#
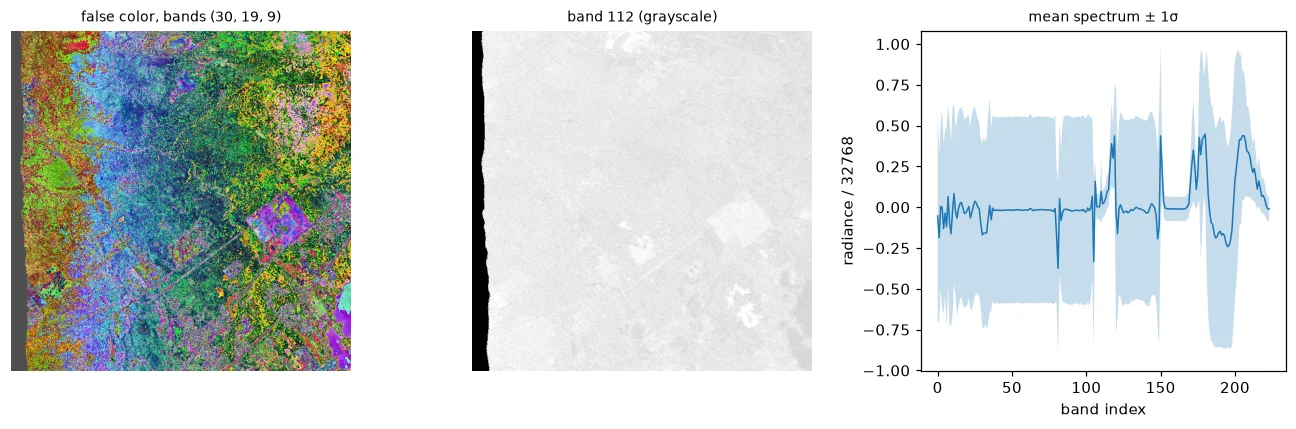
Validation tile 0 of danjacobellis/aviris_1k_val (94 tiles; eval-only) through the compressors.e2a2.recipes loader (an int16 .npy cache under ~/.cache/compressors/, because datasets cannot materialize these rows): x = int16 / 32768, no other scaling, cropped (never resized) to a multiple of the 64-px macroregion. False-color display uses bands 30 / 19 / 9 as R / G / B (≈ 650 / 550 / 450 nm), each stretched to its 1–99 % range.
x, info = load_aviris(1, coder.macroregion, volume=False, verbose=False)[0]
x = x.to(device)
origin = info['origin']
unit = coder.macroregion
n_pixels = x.shape[2] * x.shape[3]
x_01 = x / 2 + 0.5
cube = x[0]                                                 # (224, H, W)
print(f'tile origin {origin}   input {tuple(x.shape)}  ({n_pixels} pixels = '
      f'{x.shape[2] // unit} x {x.shape[3] // unit} macroregions of {unit}x{unit}),  '
      f'range [{x.min():.3f}, {x.max():.3f}]')
tile origin f110803t01p00r09_0_1 input (1, 224, 704, 704) (495616 pixels = 11 x 11 macroregions of 64x64), range [-1.000, 0.993]
RGB_BANDS = (30, 19, 9)

def false_color(t, bands=RGB_BANDS, lo_hi=None):
    """(224, H, W) tensor -> uint8 (H, W, 3), per-band 1-99 % stretch (shared lo/hi if given)."""
    a = t[list(bands)].float().cpu().numpy()
    if lo_hi is None:
        lo_hi = [np.percentile(b, (1, 99)) for b in a]
    out = np.stack([np.clip((b - lo) / (hi - lo + 1e-9), 0, 1) for b, (lo, hi) in zip(a, lo_hi)], -1)
    return (out * 255).astype(np.uint8), lo_hi

rgb, lo_hi = false_color(cube)
mid = 112
fig, axes = plt.subplots(1, 3, figsize=(12, 4), dpi=110)
axes[0].imshow(rgb); axes[0].set_title(f'false color, bands {RGB_BANDS}', fontsize=9); axes[0].axis('off')
g = cube[mid].cpu().numpy()
axes[1].imshow(g, cmap='gray', vmin=np.percentile(g, 1), vmax=np.percentile(g, 99))
axes[1].set_title(f'band {mid} (grayscale)', fontsize=9); axes[1].axis('off')
spec_mean = cube.mean(dim=(1, 2)).cpu().numpy(); spec_std = cube.std(dim=(1, 2)).cpu().numpy()
axes[2].plot(spec_mean, lw=1); axes[2].fill_between(np.arange(224), spec_mean - spec_std, spec_mean + spec_std, alpha=0.25)
axes[2].set_xlabel('band index'); axes[2].set_ylabel('radiance / 32768'); axes[2].set_title('mean spectrum ± 1σ', fontsize=9)
plt.tight_layout(); plt.show()
Analysis transform and rounding#
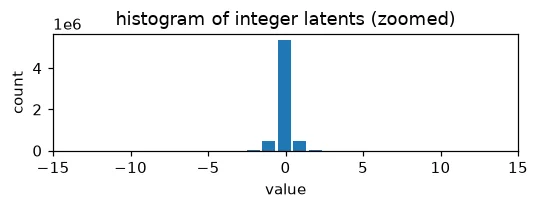
Encode to the per-scale latents (companding included) and round to the coder’s [-31, 31] grid.
with torch.no_grad():
    latents = model.encode(x)
n_latent_values = sum(z.numel() for z in latents)
print(f'{x.numel()} input values -> {n_latent_values} latent values ({n_latent_values / x.numel():.4f}x)')
for s, z in enumerate(latents):
    print(f'  scale {s+1} (ps={model.scale_groups[s][0]:>2}): latent {tuple(z.shape)}  range [{z.min():.1f}, {z.max():.1f}]')
n_clip = sum(int((z.round().abs() > 31).sum()) for z in latents)
latents_q = e2a2.encode_to_latents(model, x)
latents_np = [z[0].numpy() for z in latents_q]
print(f'clipped: {n_clip}/{n_latent_values}')

plt.figure(figsize=(5, 2), dpi=110)
plt.hist(np.concatenate([z.ravel() for z in latents_np]), range=(-31.5, 31.5), bins=63, width=0.85)
plt.xlim([-15, 15]); plt.title('histogram of integer latents (zoomed)')
plt.xlabel('value'); plt.ylabel('count'); plt.tight_layout(); plt.show()
111017984 input values -> 6396544 latent values (0.0576x)
  scale 1 (ps=16): latent (1, 8, 44, 44)  range [-3.9, 3.0]
  scale 2 (ps= 8): latent (1, 24, 88, 88)  range [-2.2, 1.7]
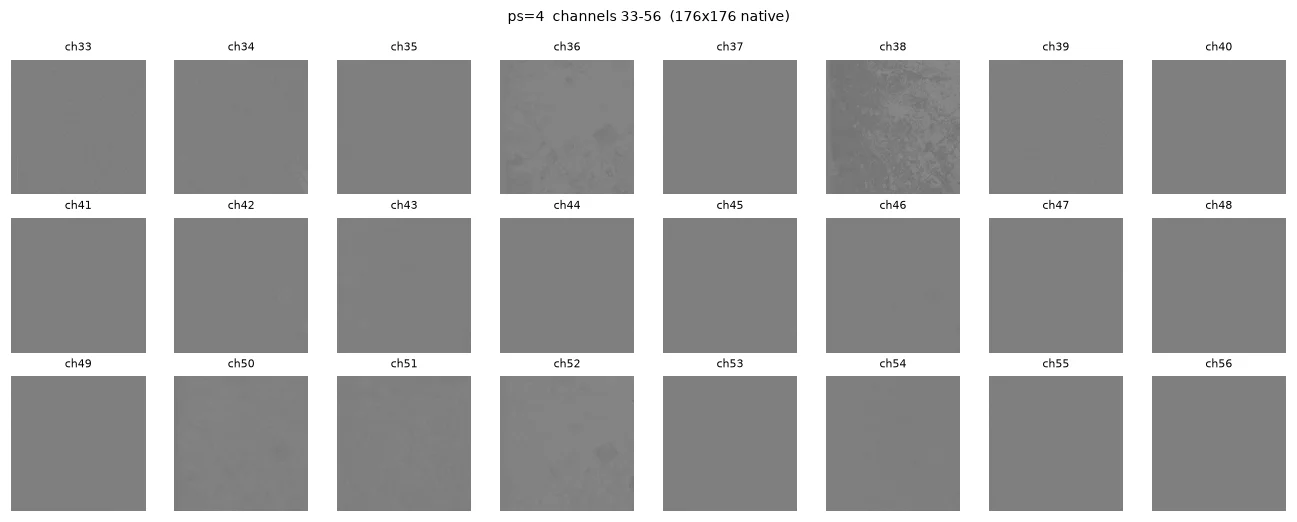
  scale 3 (ps= 4): latent (1, 24, 176, 176)  range [-3.4, 3.0]
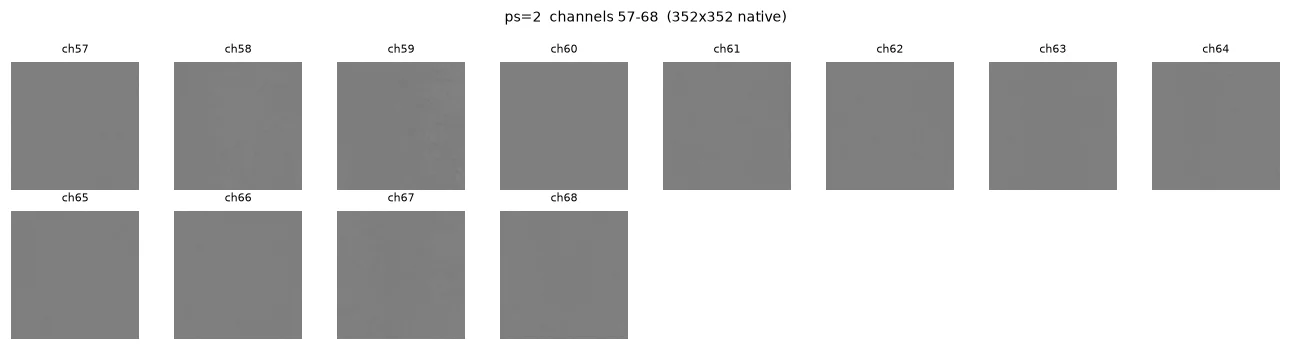
  scale 4 (ps= 2): latent (1, 12, 352, 352)  range [-3.4, 3.6]
  scale 5 (ps= 1): latent (1, 8, 704, 704)  range [-1.9, 1.6]
clipped: 0/6396544
Quantized latents (prior to entropy coding)#
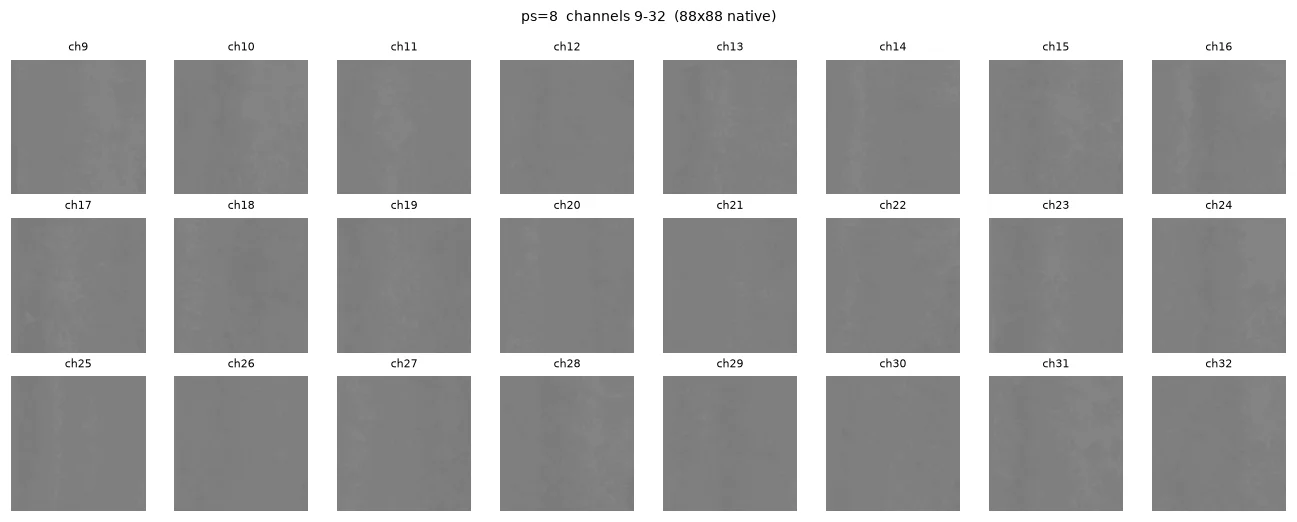
One grayscale image per channel at the latent’s native resolution, grouped by scale; alphabet [-31, 31] mapped linearly to [0, 255] (0 → mid-gray).
for s, (ps_s, start, end) in enumerate(model.scale_groups):
    z = latents_np[s]
    n_g = z.shape[0]
    cols_n = min(n_g, 8); rows_n = -(-n_g // cols_n)
    fig, axes = plt.subplots(rows_n, cols_n, figsize=(1.5 * cols_n, 1.6 * rows_n), dpi=110)
    axes = np.atleast_1d(axes).reshape(-1)
    for j in range(n_g):
        axes[j].imshow(((z[j].astype(np.int16) + 31) * 255 // 62).astype(np.uint8), cmap='gray', vmin=0, vmax=255)
        axes[j].set_title(f'ch{start + j + 1}', fontsize=7)
    for a in axes: a.axis('off')
    fig.suptitle(f'ps={ps_s}  channels {start+1}-{end}  ({z.shape[2]}x{z.shape[1]} native)', fontsize=9)
    plt.tight_layout(); plt.show()


GGDLPC two-stream entropy coding#
encode_latents produces one global stream (channels 1–8, whole plane, one byte-pad) plus one detail stream per 64×64 macroregion (one byte-pad each). The stream for operating point n is the literal bit-prefix covering channels ≤ n. CR is against the 16-bit samples (bits/voxel = bpp / 224).
enc = e2a2.encode_latents(coder, latents_q)
print(f'global stream:  {len(enc.gblob):,} bytes  (channels 1-{coder.n_coarse}, whole plane, one byte-pad)')
region_bytes = (enc.prefix[:, -1] + 7) // 8
print(f'detail streams: {len(enc.streams)} macroregions, one byte-pad each; at max detail '
      f'{int(region_bytes.sum()):,} bytes total, per region min/median/max = '
      f'{int(region_bytes.min())}/{int(np.median(region_bytes))}/{int(region_bytes.max())}')
print(f'\n{"op":>4} {"stream bits":>12} {"bpp":>10} {"bits/voxel":>11} {"CR":>9} {"bits/latent":>12}')
for n in ops:
    bits = e2a2.op_bits(coder, enc, n)
    n_lat_n = sum(min(max(n - start, 0), end - start) * z.shape[1] * z.shape[2]
                  for z, (ps_s, start, end) in zip(latents_np, model.scale_groups))
    bpp = bits / n_pixels
    print(f'{n:>4} {bits:>12,} {bpp:>10.6f} {bpp / 224:>11.2e} {16 / (bpp / 224):>8.0f}x {bits / n_lat_n:>12.3f}')
global stream:  2,923 bytes  (channels 1-8, whole plane, one byte-pad)
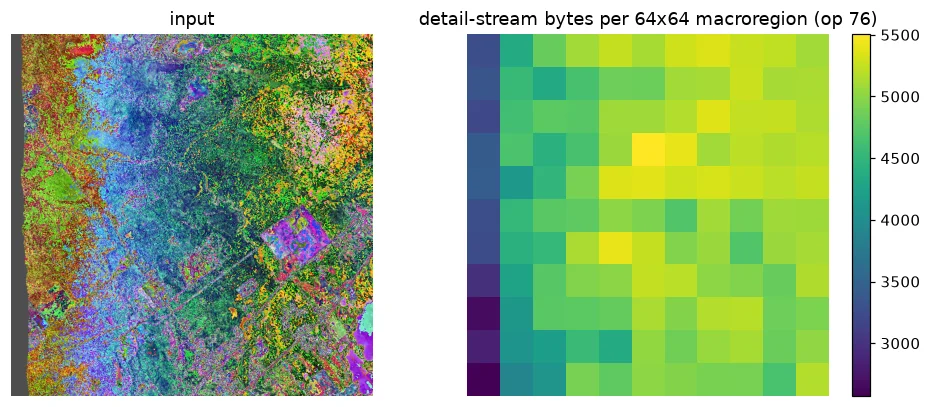
detail streams: 121 macroregions, one byte-pad each; at max detail 576,448 bytes total, per region min/median/max = 2572/4955/5505

  op  stream bits        bpp  bits/voxel        CR  bits/latent
   8       23,384   0.047182    2.11e-04    75962x        1.510
  32      209,080   0.421859    1.88e-03     8496x        1.038
  56      600,296   1.211212    5.41e-03     2959x        0.635
  68    3,177,464   6.411141    2.86e-02      559x        1.307
  76    4,634,968   9.351934    4.17e-02      383x        0.725
Round-trip verification#
verify_latents decodes the latents back from the truncated bytes alone at every operating point’s literal bit-prefix (the global stream from its own bytes; every macroregion from its own bytes, no cross-region input) and asserts them bit-exact against the encoder’s. The reconstructions below are decoded from those byte-decoded latents (decode_latents), not from the encoder’s copy.
e2a2.verify_latents(coder, enc, latents_q, ops)
print(f'round trip verified at ops {ops}: every op decoded from its truncated bytes alone, bit-exact')
round trip verified at ops [8, 32, 56, 68, 76]: every op decoded from its truncated bytes alone, bit-exact
Reconstructions at each operating point#
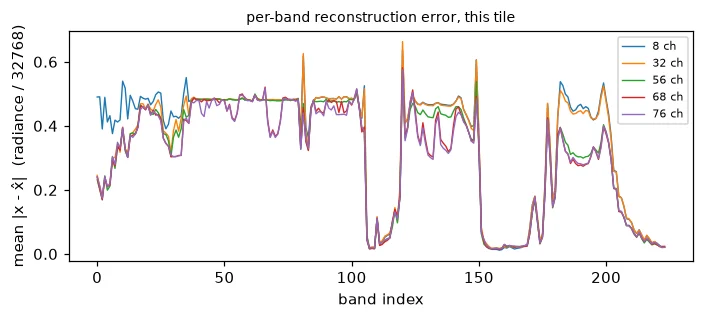
One encode serves every operating point: the latents for op n are decoded from the truncated bytes and fed to that point’s own merged decoder; the rate is the same encode’s literal bit-prefix. PSNR is the trainer’s: on (x+1)/2 vs (x̂+1)/2, x̂ clamped to [-1, 1], over all 224 bands. A fixed 256×256 crop (false color, shared stretch) of the original (left) and the reconstruction (right) per point, then the per-band mean |x − x̂| over the tile.
def psnr_of(xh):
    return -10 * torch.nn.functional.mse_loss(x_01, xh / 2 + 0.5).log10().item()

ch_, cw_ = 256, 256
ct = (x.shape[2] - ch_) // 2
cl = (x.shape[3] - cw_) // 2
rd_tile, err_bands = [], {}
fig, axes = plt.subplots(len(ops), 2, figsize=(6, 3.1 * len(ops)), dpi=110)
for i, n in enumerate(ops):
    lts = e2a2.decode_latents(coder, enc, n)
    with torch.no_grad():
        xh = models[n].decode([z.to(device) for z in lts]).clamp(-1, 1)
    bpp_n = e2a2.op_bits(coder, enc, n) / n_pixels
    psnr_n = psnr_of(xh)
    rd_tile.append((bpp_n, psnr_n, n))
    err_bands[n] = (cube - xh[0]).abs().mean(dim=(1, 2)).cpu().numpy()
    axes[i, 0].imshow(rgb[ct:ct+ch_, cl:cl+cw_]); axes[i, 0].set_title('original', fontsize=8)
    axes[i, 1].imshow(false_color(xh[0, :, ct:ct+ch_, cl:cl+cw_], lo_hi=lo_hi)[0])
    axes[i, 1].set_title(f'{n} ch: {bpp_n:.4f} bpp, {psnr_n:.2f} dB', fontsize=8)
    for a in axes[i]: a.axis('off')
    del xh
plt.tight_layout(); plt.show()

print(f'{"op":>4} {"PSNR (dB)":>10} {"bpp":>10} {"bits/voxel":>11} {"CR":>8}')
for bpp_n, psnr_n, n in rd_tile:
    print(f'{n:>4} {psnr_n:>10.4f} {bpp_n:>10.6f} {bpp_n / 224:>11.2e} {16 / (bpp_n / 224):>7.0f}x')

plt.figure(figsize=(6.5, 3), dpi=110)
for n in ops:
    plt.plot(err_bands[n], lw=0.9, label=f'{n} ch')
plt.xlabel('band index'); plt.ylabel('mean |x - x̂|  (radiance / 32768)')
plt.title('per-band reconstruction error, this tile', fontsize=9); plt.legend(fontsize=7)
plt.tight_layout(); plt.show()
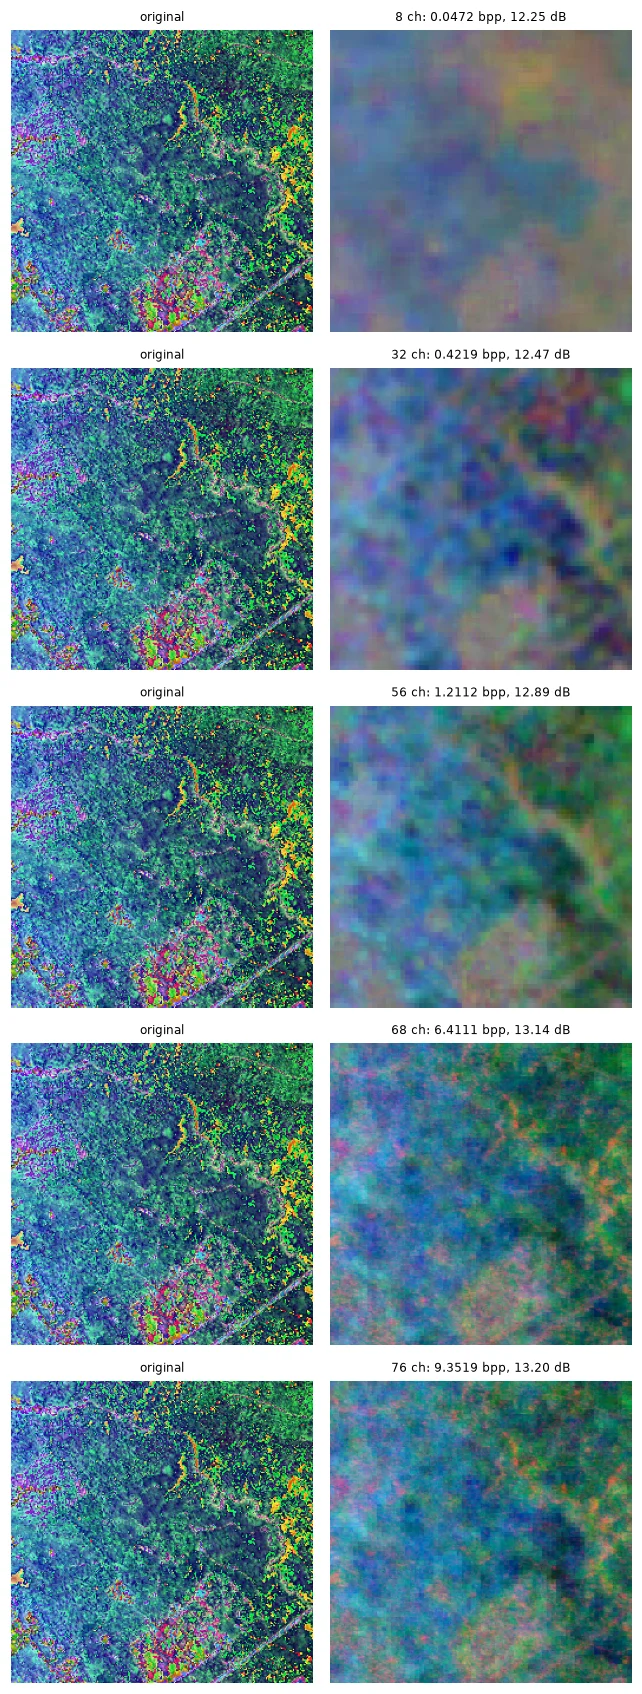
  op  PSNR (dB)        bpp  bits/voxel       CR
   8    12.2536   0.047182    2.11e-04   75962x
  32    12.4725   0.421859    1.88e-03    8496x
  56    12.8882   1.211212    5.41e-03    2959x
  68    13.1390   6.411141    2.86e-02     559x
  76    13.1982   9.351934    4.17e-02     383x
Per-macroregion rate map#
Each macroregion carries its own byte-padded detail stream, so the spatial rate allocation is directly visible.
nuh, nuw = x.shape[2] // unit, x.shape[3] // unit
fig, axes = plt.subplots(1, 2, figsize=(9, 3.8), dpi=110)
axes[0].imshow(rgb); axes[0].set_title('input'); axes[0].axis('off')
im = axes[1].imshow(region_bytes.reshape(nuh, nuw), cmap='viridis')
axes[1].set_title(f'detail-stream bytes per {unit}x{unit} macroregion (op {ops[-1]})'); axes[1].axis('off')
fig.colorbar(im, ax=axes[1], fraction=0.046)
plt.tight_layout(); plt.show()
Rate–distortion#
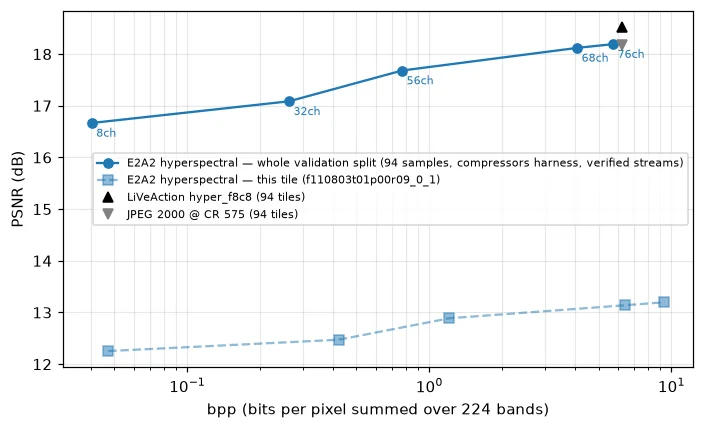
This tile’s operating points over the 94-tile whole-validation curve from results/e2a2_hyperspectral/ (falls back to the hub rd.json). No in-repo baseline exists for this modality; the reference points on the same 94 tiles, quoted from the trainer ledger, are LiVeAction hyper_f8c8 (18.52 dB @ 6.23 bpp = 0.0278 bits/voxel, CR 575) and JPEG 2000 at the same CR (18.18 dB).
def latest(pattern):
    paths = sorted(glob.glob(pattern))
    return paths[-1] if paths else None

rd_path = latest(f'results/e2a2_{NAME}/rate_distortion_*.json')
if rd_path is not None:
    rd = json.load(open(rd_path))
    key = 'channel_counts' if 'channel_counts' in rd else 'quality_values'
    rd_ops = list(rd[key])
    rd_label = f"E2A2 {NAME} — whole validation split ({rd.get('n_images', rd.get('n_samples'))} samples, compressors harness, verified streams)"
else:
    rd = None
    hub_rd = e2a2.hub_rd_curve(NAME)
    rd_ops = [p['n_ch'] for p in hub_rd['rd_curve']]
    rd_label = f"E2A2 {NAME} — whole validation split (hub rd.json, trainer's verified streams)"

if rd is not None:
    val_bpp = [rd['results'][str(n)]['mean']['bpp'] for n in rd_ops]
    val_psnr = [rd['results'][str(n)]['mean']['PSNR_dB'] for n in rd_ops]
else:
    val_bpp = [p['bpp'] for p in hub_rd['rd_curve']]; val_psnr = [p['psnr'] for p in hub_rd['rd_curve']]
ref_bpp = 16 / 575 * 224

plt.figure(figsize=(6.5, 4), dpi=110)
plt.semilogx(val_bpp, val_psnr, 'o-', color='tab:blue', label=rd_label)
plt.semilogx([p[0] for p in rd_tile], [p[1] for p in rd_tile], 's--', color='tab:blue', alpha=0.5, label=f'E2A2 hyperspectral — this tile ({origin})')
plt.semilogx([ref_bpp], [18.52], '^', color='black', ms=7, label='LiVeAction hyper_f8c8 (94 tiles)')
plt.semilogx([ref_bpp], [18.18], 'v', color='0.5', ms=7, label='JPEG 2000 @ CR 575 (94 tiles)')
for n, bv, psv in zip(rd_ops, val_bpp, val_psnr):
    plt.annotate(f'{n}ch', (bv, psv), fontsize=7, color='tab:blue', xytext=(3, -9), textcoords='offset points')
plt.xlabel('bpp (bits per pixel summed over 224 bands)'); plt.ylabel('PSNR (dB)')
plt.grid(True, which='both', alpha=0.3); plt.legend(fontsize=7); plt.tight_layout(); plt.show()

print(f'{"op":>4} {"PSNR (94)":>10} {"bpp (94)":>10} {"bits/voxel":>11} {"CR":>7}')
for n, bv, psv in zip(rd_ops, val_bpp, val_psnr):
    print(f'{n:>4} {psv:>10.4f} {bv:>10.6f} {bv / 224:>11.2e} {16 / (bv / 224):>6.0f}x')
  op  PSNR (94)   bpp (94)  bits/voxel      CR
   8    16.6667   0.040316    1.80e-04  88897x
  32    17.0859   0.263143    1.17e-03  13620x
  56    17.6815   0.771560    3.44e-03   4645x
  68    18.1192   4.074932    1.82e-02    880x
  76    18.1922   5.738283    2.56e-02    625x